Documentation on region.php: You need to include three parameters: region (which can typically take a value of a country, though some larger regions are also allowed), start_date (which is of the form YYYY0000), and end_date (which is of the form YYYY0000). Both start_date and end_date are inclusive. For instance, to get data for India from 1970 to 2010, use /region.php?region=India&start_date=19700000&end_date=20100000.
| Dataset and exact metric name | Average | Growth (start to end, using linear fit on logarithm) | 19700000 | 19710000 | 19720000 | 19730000 | 19740000 | 19750000 | 19760000 | 19770000 | 19780000 | 19790000 | 19800000 | 19810000 | 19820000 | 19830000 | 19840000 | 19850000 | 19860000 | 19870000 | 19880000 | 19890000 | 19900000 |
|---|---|---|---|---|---|---|---|---|---|---|---|---|---|---|---|---|---|---|---|---|---|---|---|
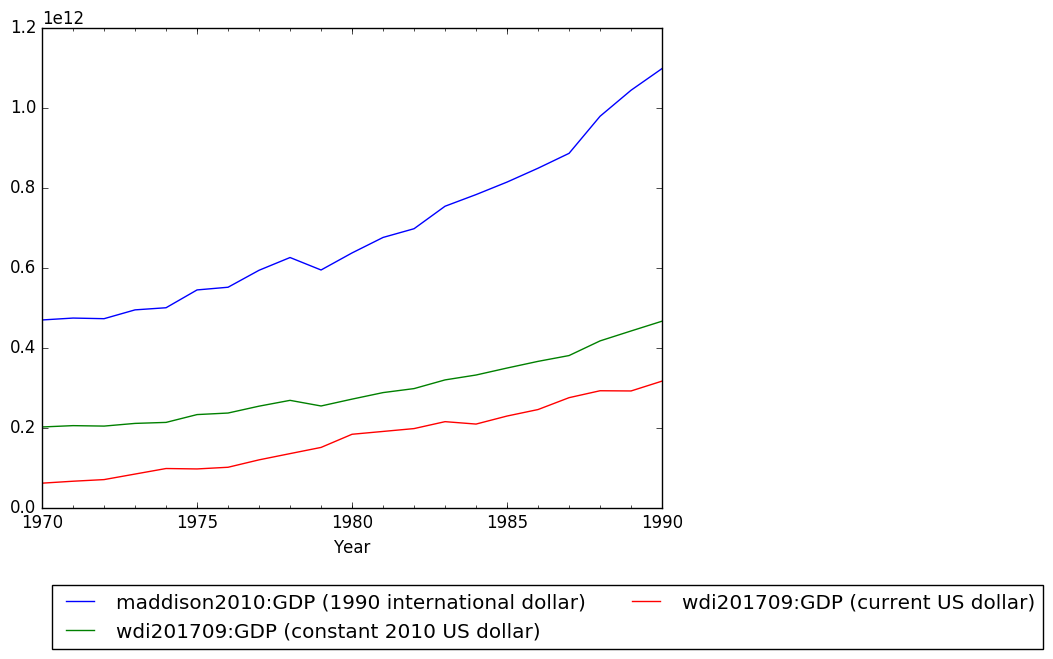
| India: maddison2010:GDP (1990 international dollar) | 692,375,473,981 | 136.54% | 469,583,986,688 | 474,338,000,896 | 472,765,988,864 | 494,831,992,832 | 500,146,012,160 | 544,682,999,808 | 551,402,012,672 | 593,834,016,768 | 625,694,998,528 | 594,510,020,608 | 637,202,006,016 | 675,882,008,576 | 697,704,972,288 | 753,942,003,712 | 783,042,019,328 | 814,343,979,008 | 848,989,978,624 | 886,154,002,432 | 978,821,971,968 | 1,043,911,999,488 | 1,098,099,982,336 |
| India: wdi201709:GDP (constant 2015 US dollar) | 295,129,527,247 | 134.04% | 201,528,934,400 | 204,839,911,424 | 203,706,531,840 | 210,419,728,384 | 212,913,897,472 | 232,395,341,824 | 236,260,311,040 | 253,400,449,024 | 267,876,024,320 | 253,844,193,280 | 270,942,683,136 | 287,216,041,984 | 297,198,911,488 | 318,861,410,304 | 331,044,290,560 | 348,438,331,392 | 365,081,722,880 | 379,558,494,208 | 416,101,564,416 | 440,848,580,608 | 465,242,718,208 |
| India: wdi201709:GDP (current US dollar) | 175,444,787,200 | 438.43% | 62,422,482,944 | 67,350,986,752 | 71,463,190,528 | 85,515,272,192 | 99,525,902,336 | 98,472,796,160 | 102,717,161,472 | 121,487,319,040 | 137,300,295,680 | 152,991,645,696 | 186,325,352,448 | 193,490,616,320 | 200,715,141,120 | 218,262,274,048 | 212,158,234,624 | 232,511,881,216 | 248,985,993,216 | 279,033,577,472 | 296,589,000,704 | 296,042,364,928 | 320,979,042,304 |
| Dataset and exact metric name | Average | Growth (start to end, using linear fit on logarithm) | 19700000 | 19710000 | 19720000 | 19730000 | 19740000 | 19750000 | 19760000 | 19770000 | 19780000 | 19790000 | 19800000 | 19810000 | 19820000 | 19830000 | 19840000 | 19850000 | 19860000 | 19870000 | 19880000 | 19890000 | 19900000 |
|---|---|---|---|---|---|---|---|---|---|---|---|---|---|---|---|---|---|---|---|---|---|---|---|
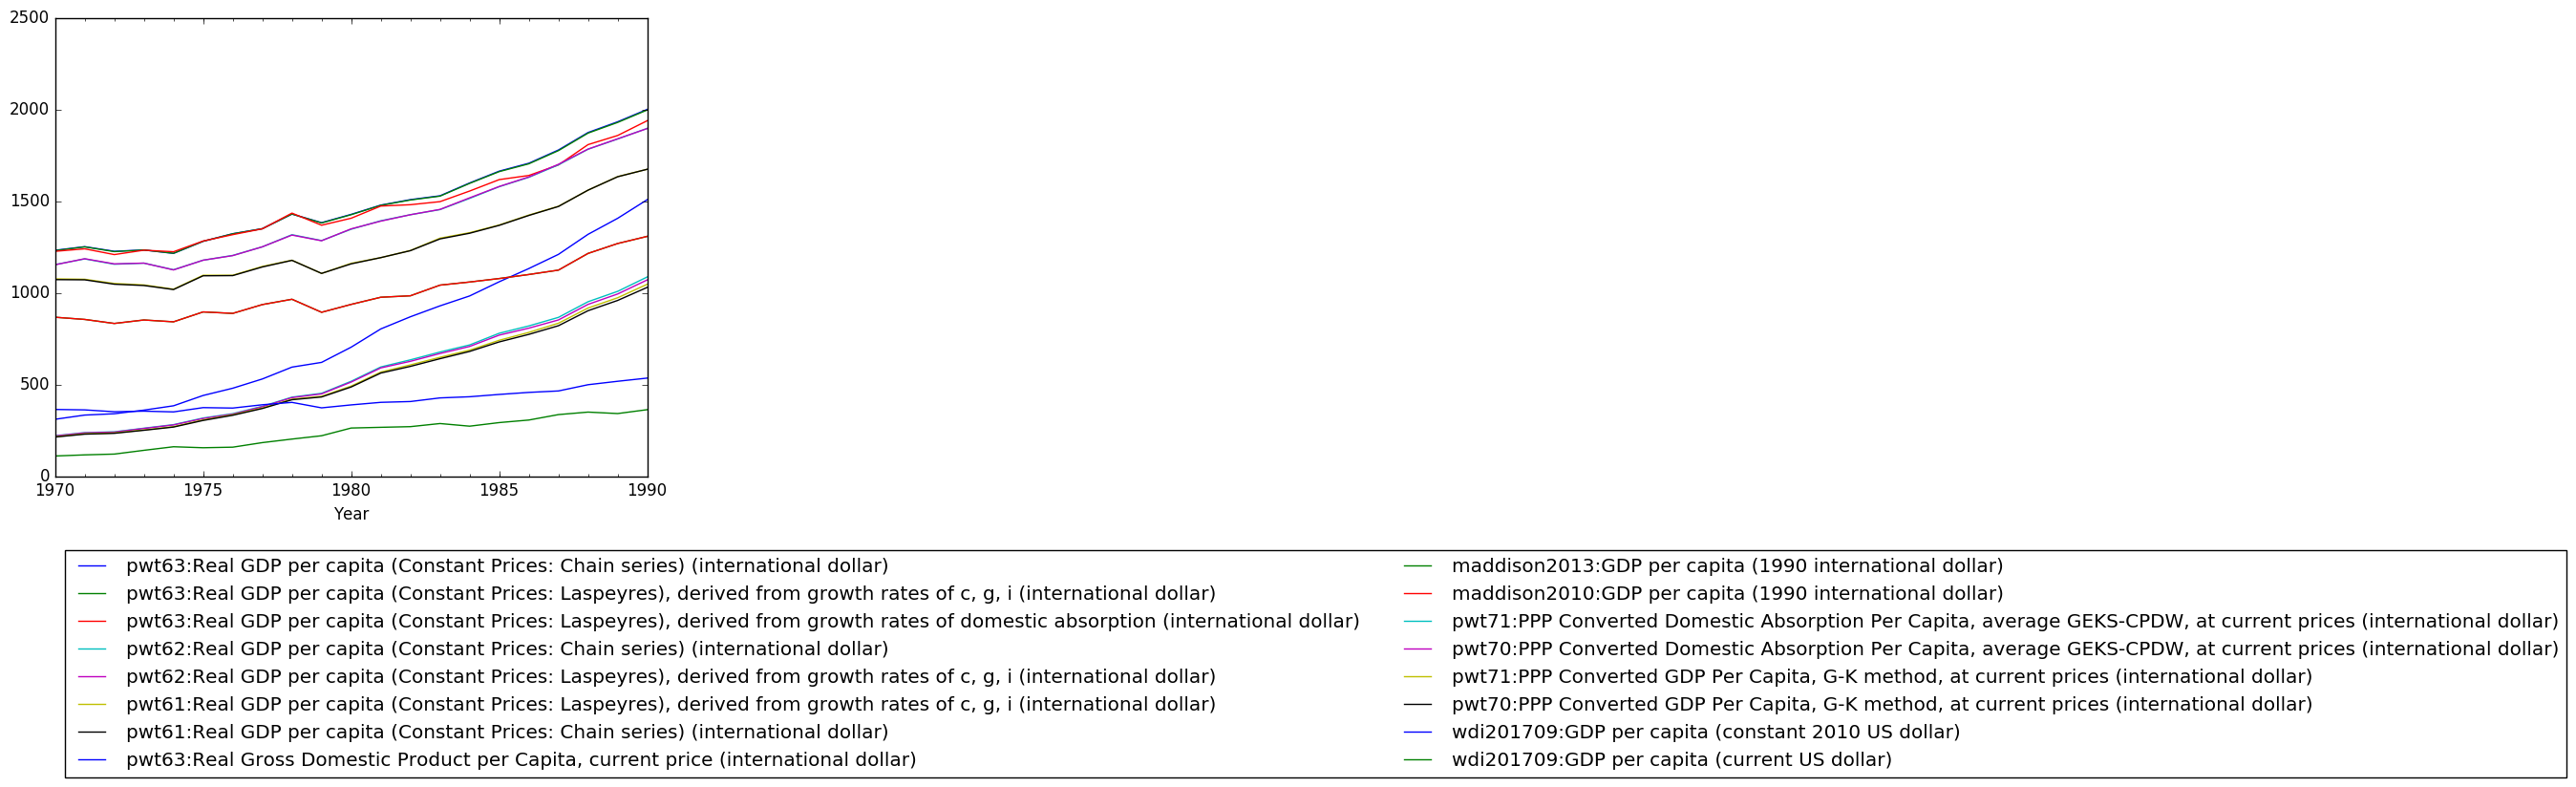
| India: maddison2010:GDP per capita (1990 international dollar) | 997 | 52.67% | 868 | 856 | 834 | 853 | 843 | 897 | 889 | 937 | 966 | 895 | 938 | 977 | 985 | 1,043 | 1,060 | 1,079 | 1,101 | 1,125 | 1,216 | 1,270 | 1,309 |
| India: maddison2013:GDP per capita (1990 international dollar) | 997 | 52.67% | 868 | 856 | 834 | 853 | 843 | 897 | 889 | 937 | 966 | 895 | 938 | 977 | 985 | 1,043 | 1,060 | 1,079 | 1,101 | 1,125 | 1,216 | 1,270 | 1,309 |
| India: pwt61:Real GDP per capita (Constant Prices: Chain series) (international dollar) | 1,248 | 60.81% | 1,073 | 1,072 | 1,048 | 1,041 | 1,019 | 1,094 | 1,095 | 1,142 | 1,178 | 1,107 | 1,159 | 1,193 | 1,231 | 1,295 | 1,326 | 1,369 | 1,423 | 1,472 | 1,561 | 1,634 | 1,675 |
| India: pwt61:Real GDP per capita (Constant Prices: Laspeyres), derived from growth rates of c, g, i (international dollar) | 1,250 | 60.36% | 1,077 | 1,075 | 1,052 | 1,044 | 1,021 | 1,097 | 1,097 | 1,145 | 1,179 | 1,107 | 1,162 | 1,193 | 1,232 | 1,299 | 1,329 | 1,371 | 1,425 | 1,473 | 1,561 | 1,635 | 1,675 |
| India: pwt62:Real GDP per capita (Constant Prices: Chain series) (international dollar) | 1,410 | 69.55% | 1,155 | 1,186 | 1,157 | 1,163 | 1,127 | 1,179 | 1,205 | 1,252 | 1,318 | 1,286 | 1,348 | 1,394 | 1,427 | 1,455 | 1,516 | 1,580 | 1,631 | 1,699 | 1,784 | 1,840 | 1,898 |
| India: pwt62:Real GDP per capita (Constant Prices: Laspeyres), derived from growth rates of c, g, i (international dollar) | 1,410 | 69.71% | 1,154 | 1,187 | 1,159 | 1,163 | 1,126 | 1,179 | 1,204 | 1,252 | 1,316 | 1,285 | 1,350 | 1,392 | 1,427 | 1,456 | 1,519 | 1,581 | 1,633 | 1,702 | 1,785 | 1,841 | 1,897 |
| India: pwt63:Real GDP per capita (Constant Prices: Chain series) (international dollar) | 1,497 | 65.30% | 1,233 | 1,253 | 1,228 | 1,235 | 1,216 | 1,282 | 1,323 | 1,351 | 1,430 | 1,384 | 1,429 | 1,479 | 1,509 | 1,530 | 1,600 | 1,665 | 1,708 | 1,780 | 1,875 | 1,934 | 2,002 |
| India: pwt63:Real GDP per capita (Constant Prices: Laspeyres), derived from growth rates of c, g, i (international dollar) | 1,496 | 65.04% | 1,232 | 1,252 | 1,226 | 1,235 | 1,217 | 1,282 | 1,323 | 1,351 | 1,431 | 1,382 | 1,427 | 1,478 | 1,507 | 1,528 | 1,598 | 1,662 | 1,705 | 1,777 | 1,872 | 1,930 | 1,998 |
| India: pwt63:Real GDP per capita (Constant Prices: Laspeyres), derived from growth rates of domestic absorption (international dollar) | 1,470 | 58.36% | 1,227 | 1,241 | 1,210 | 1,234 | 1,225 | 1,284 | 1,318 | 1,350 | 1,436 | 1,370 | 1,408 | 1,474 | 1,482 | 1,498 | 1,556 | 1,618 | 1,641 | 1,698 | 1,809 | 1,859 | 1,940 |
| India: pwt63:Real Gross Domestic Product per Capita, current price (international dollar) | 778 | 432.84% | 312 | 334 | 342 | 361 | 385 | 441 | 481 | 531 | 596 | 622 | 705 | 804 | 871 | 930 | 984 | 1,061 | 1,134 | 1,211 | 1,320 | 1,407 | 1,509 |
| India: pwt70:PPP Converted Domestic Absorption Per Capita, average GEKS-CPDW, at current prices (international dollar) | 557 | 431.38% | 221 | 238 | 242 | 261 | 281 | 316 | 340 | 380 | 430 | 450 | 515 | 592 | 628 | 670 | 709 | 770 | 809 | 853 | 938 | 995 | 1,072 |
| India: pwt70:PPP Converted GDP Per Capita, G-K method, at current prices (international dollar) | 536 | 424.77% | 215 | 230 | 235 | 251 | 269 | 305 | 333 | 370 | 418 | 433 | 488 | 564 | 600 | 642 | 681 | 733 | 775 | 822 | 904 | 960 | 1,031 |
| India: pwt71:PPP Converted Domestic Absorption Per Capita, average GEKS-CPDW, at current prices (international dollar) | 564 | 437.79% | 222 | 239 | 243 | 263 | 282 | 318 | 342 | 382 | 432 | 453 | 519 | 597 | 636 | 678 | 717 | 781 | 821 | 867 | 953 | 1,009 | 1,088 |
| India: pwt71:PPP Converted GDP Per Capita, G-K method, at current prices (international dollar) | 543 | 429.20% | 216 | 233 | 237 | 253 | 271 | 308 | 336 | 373 | 421 | 437 | 492 | 569 | 608 | 650 | 688 | 742 | 785 | 835 | 918 | 974 | 1,048 |
| India: wdi201709:GDP per capita (constant 2015 US dollar) | 412 | 48.27% | 363 | 361 | 351 | 354 | 350 | 373 | 371 | 388 | 401 | 372 | 388 | 401 | 406 | 425 | 432 | 444 | 455 | 463 | 497 | 515 | 533 |
| India: wdi201709:GDP per capita (current US dollar) | 238 | 241.10% | 112 | 119 | 123 | 144 | 163 | 158 | 161 | 186 | 206 | 224 | 267 | 270 | 274 | 291 | 277 | 296 | 310 | 340 | 354 | 346 | 368 |
| Dataset and exact metric name | Average | Growth (start to end, using linear fit on logarithm) | 19700000 | 19710000 | 19720000 | 19730000 | 19740000 | 19750000 | 19760000 | 19770000 | 19780000 | 19790000 | 19800000 | 19810000 | 19820000 | 19830000 | 19840000 | 19850000 | 19860000 | 19870000 | 19880000 | 19890000 | 19900000 |
|---|---|---|---|---|---|---|---|---|---|---|---|---|---|---|---|---|---|---|---|---|---|---|---|
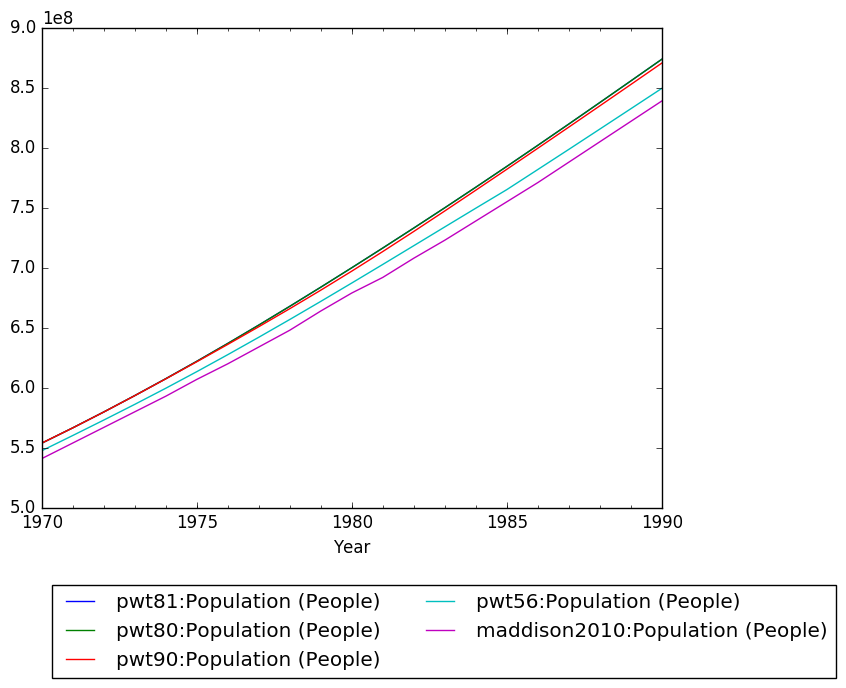
| India: maddison2010:Population (People) | 682,333,333 | 54.98% | 541,000,000 | 554,000,000 | 567,000,000 | 580,000,000 | 593,000,000 | 607,000,000 | 620,000,000 | 634,000,000 | 648,000,000 | 664,000,000 | 679,000,000 | 692,000,000 | 708,000,000 | 723,000,000 | 739,000,000 | 755,000,000 | 771,000,000 | 788,000,000 | 805,000,000 | 822,000,000 | 839,000,000 |
| India: pwt56:Population (People) | 691,176,430 | 55.42% | 547,569,024 | 560,268,032 | 573,129,984 | 586,220,032 | 599,643,008 | 613,459,008 | 627,632,000 | 642,134,016 | 656,940,992 | 672,020,992 | 687,331,968 | 702,820,992 | 718,425,984 | 734,072,000 | 749,676,992 | 765,147,008 | 781,892,992 | 798,680,000 | 815,590,016 | 832,534,976 | 849,515,008 |
| India: pwt80:Population (People) | 705,004,386 | 58.34% | 553,873,920 | 566,651,456 | 579,871,104 | 593,526,656 | 607,606,592 | 622,096,704 | 636,992,576 | 652,279,296 | 667,917,440 | 683,857,280 | 700,058,560 | 716,493,312 | 733,151,744 | 750,033,536 | 767,146,816 | 784,490,816 | 802,051,776 | 819,800,064 | 837,699,648 | 855,707,328 | 873,785,472 |
| India: pwt81:Population (People) | 705,004,386 | 58.34% | 553,873,920 | 566,651,456 | 579,871,104 | 593,526,656 | 607,606,592 | 622,096,704 | 636,992,576 | 652,279,296 | 667,917,440 | 683,857,280 | 700,058,560 | 716,493,312 | 733,151,744 | 750,033,536 | 767,146,816 | 784,490,816 | 802,051,776 | 819,800,064 | 837,699,648 | 855,707,328 | 873,785,472 |
| India: pwt90:Population (People) | 703,222,729 | 57.69% | 553,943,232 | 566,605,376 | 579,800,640 | 593,451,904 | 607,446,528 | 621,703,616 | 636,182,784 | 650,907,584 | 665,936,448 | 681,358,528 | 697,229,760 | 713,561,408 | 730,303,488 | 747,374,848 | 764,664,256 | 782,085,120 | 799,607,232 | 817,232,256 | 834,944,384 | 852,736,128 | 870,601,792 |