Documentation on region.php: You need to include three parameters: region (which can typically take a value of a country, though some larger regions are also allowed), start_date (which is of the form YYYY0000), and end_date (which is of the form YYYY0000). Both start_date and end_date are inclusive. For instance, to get data for India from 1970 to 2010, use /region.php?region=India&start_date=19700000&end_date=20100000.
| Dataset and exact metric name | Average | Growth (start to end, using linear fit on logarithm) | 19900000 | 19910000 | 19920000 | 19930000 | 19940000 | 19950000 | 19960000 | 19970000 | 19980000 | 19990000 | 20000000 | 20010000 | 20020000 | 20030000 | 20040000 | 20050000 | 20060000 | 20070000 | 20080000 | 20090000 | 20100000 |
|---|---|---|---|---|---|---|---|---|---|---|---|---|---|---|---|---|---|---|---|---|---|---|---|
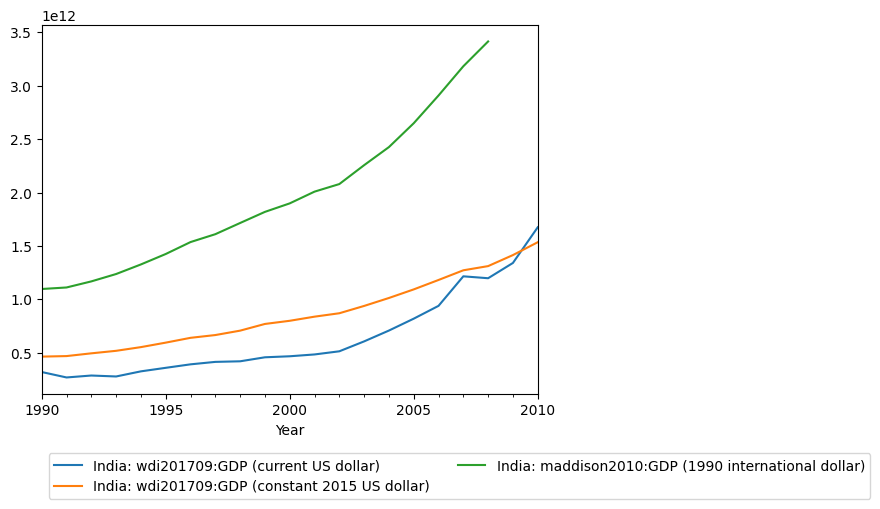
| India: maddison2010:GDP (1990 international dollar) | 1,941,370,796,355 | 210.39% | 1,098,099,982,336 | 1,112,340,037,632 | 1,169,301,045,248 | 1,238,272,049,152 | 1,328,047,063,040 | 1,425,622,958,080 | 1,537,382,940,672 | 1,611,108,057,088 | 1,715,942,981,632 | 1,819,936,948,224 | 1,899,525,963,776 | 2,009,448,054,784 | 2,080,337,035,264 | 2,257,166,008,320 | 2,426,453,098,496 | 2,649,687,064,576 | 2,909,355,900,928 | 3,182,835,007,488 | 3,415,182,934,016 | -- | -- |
| India: wdi201709:GDP (constant 2015 US dollar) | 865,069,039,616 | 237.84% | 465,242,718,208 | 470,159,556,608 | 495,935,553,536 | 519,496,335,360 | 554,089,185,280 | 596,058,636,288 | 641,058,209,792 | 667,019,968,512 | 708,271,210,496 | 770,923,167,744 | 800,534,298,624 | 839,151,779,840 | 871,072,923,648 | 939,542,577,152 | 1,013,981,904,896 | 1,094,324,060,160 | 1,182,534,598,656 | 1,273,126,453,248 | 1,312,423,936,000 | 1,415,605,256,192 | 1,535,897,501,696 |
| India: wdi201709:GDP (current US dollar) | 643,546,625,755 | 470.79% | 320,979,042,304 | 270,105,346,048 | 288,208,420,864 | 279,296,016,384 | 327,275,577,344 | 360,281,964,544 | 392,897,069,056 | 415,867,764,736 | 421,351,489,536 | 458,820,419,584 | 468,394,934,272 | 485,441,011,712 | 514,937,946,112 | 607,699,271,680 | 709,148,540,928 | 820,381,614,080 | 940,259,868,672 | 1,216,735,477,760 | 1,198,895,529,984 | 1,341,886,562,304 | 1,675,615,272,960 |
| Dataset and exact metric name | Average | Growth (start to end, using linear fit on logarithm) | 19900000 | 19910000 | 19920000 | 19930000 | 19940000 | 19950000 | 19960000 | 19970000 | 19980000 | 19990000 | 20000000 | 20010000 | 20020000 | 20030000 | 20040000 | 20050000 | 20060000 | 20070000 | 20080000 | 20090000 | 20100000 |
|---|---|---|---|---|---|---|---|---|---|---|---|---|---|---|---|---|---|---|---|---|---|---|---|
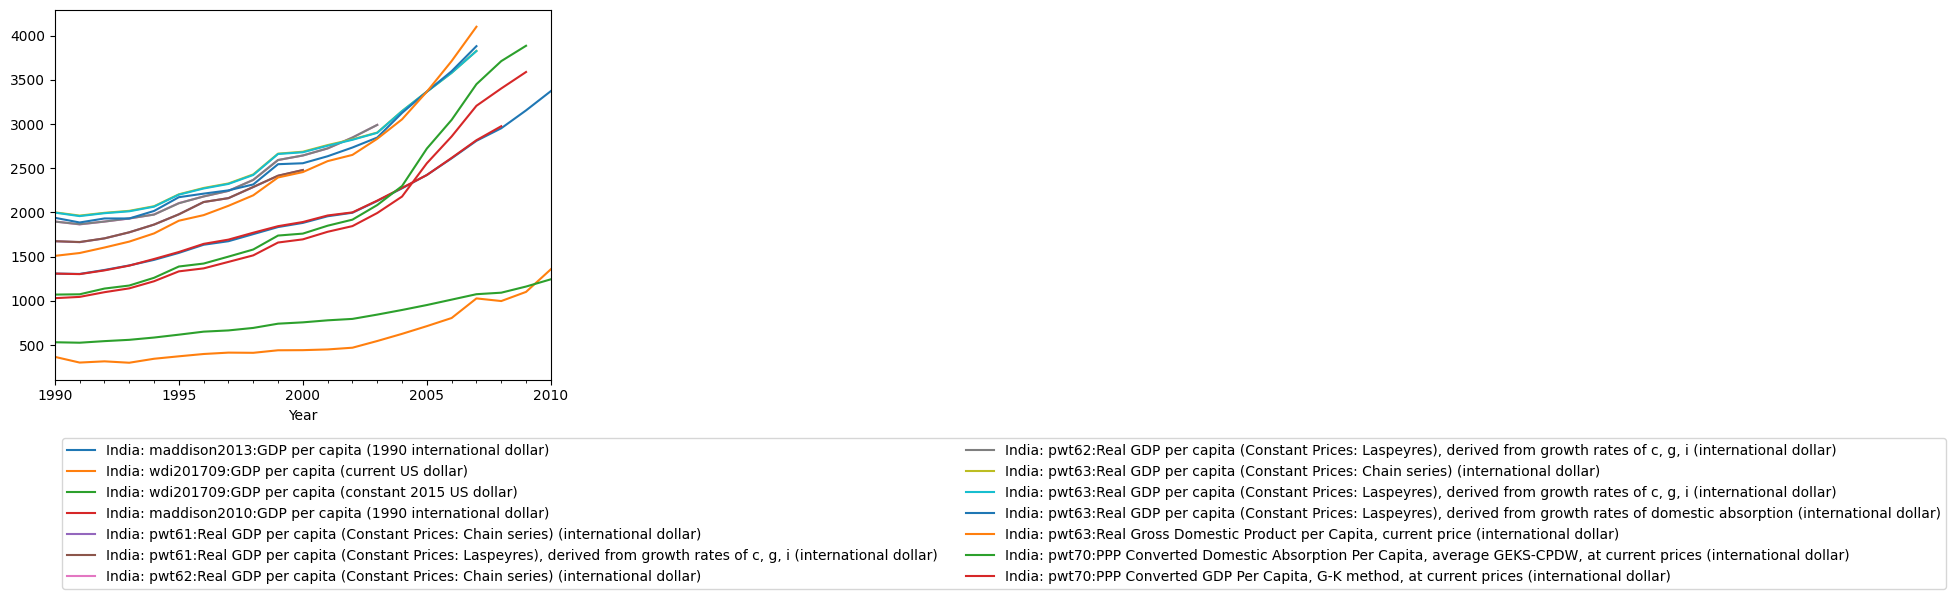
| India: maddison2010:GDP per capita (1990 international dollar) | 1,918 | 126.65% | 1,309 | 1,303 | 1,345 | 1,399 | 1,474 | 1,553 | 1,645 | 1,693 | 1,771 | 1,845 | 1,892 | 1,966 | 2,001 | 2,134 | 2,278 | 2,423 | 2,617 | 2,817 | 2,975 | -- | -- |
| India: maddison2013:GDP per capita (1990 international dollar) | 2,040 | 158.93% | 1,309 | 1,305 | 1,350 | 1,401 | 1,464 | 1,543 | 1,635 | 1,675 | 1,755 | 1,835 | 1,882 | 1,957 | 1,997 | 2,130 | 2,273 | 2,424 | 2,612 | 2,810 | 2,952 | 3,154 | 3,372 |
| India: pwt61:Real GDP per capita (Constant Prices: Chain series) (international dollar) | 2,011 | 55.39% | 1,675 | 1,664 | 1,707 | 1,775 | 1,863 | 1,979 | 2,118 | 2,162 | 2,287 | 2,414 | 2,479 | -- | -- | -- | -- | -- | -- | -- | -- | -- | -- |
| India: pwt61:Real GDP per capita (Constant Prices: Laspeyres), derived from growth rates of c, g, i (international dollar) | 2,012 | 55.40% | 1,675 | 1,666 | 1,707 | 1,776 | 1,863 | 1,979 | 2,118 | 2,162 | 2,288 | 2,416 | 2,480 | -- | -- | -- | -- | -- | -- | -- | -- | -- | -- |
| India: pwt62:Real GDP per capita (Constant Prices: Chain series) (international dollar) | 2,305 | 66.07% | 1,898 | 1,865 | 1,897 | 1,931 | 1,977 | 2,106 | 2,181 | 2,244 | 2,368 | 2,593 | 2,644 | 2,724 | 2,847 | 2,990 | -- | -- | -- | -- | -- | -- | -- |
| India: pwt62:Real GDP per capita (Constant Prices: Laspeyres), derived from growth rates of c, g, i (international dollar) | 2,305 | 66.03% | 1,897 | 1,867 | 1,897 | 1,933 | 1,976 | 2,104 | 2,181 | 2,244 | 2,368 | 2,593 | 2,644 | 2,724 | 2,847 | 2,990 | -- | -- | -- | -- | -- | -- | -- |
| India: pwt63:Real GDP per capita (Constant Prices: Chain series) (international dollar) | 2,614 | 94.61% | 2,002 | 1,965 | 1,996 | 2,018 | 2,071 | 2,205 | 2,277 | 2,328 | 2,430 | 2,665 | 2,687 | 2,762 | 2,827 | 2,903 | 3,146 | 3,365 | 3,579 | 3,826 | -- | -- | -- |
| India: pwt63:Real GDP per capita (Constant Prices: Laspeyres), derived from growth rates of c, g, i (international dollar) | 2,610 | 95.07% | 1,998 | 1,959 | 1,992 | 2,013 | 2,066 | 2,202 | 2,271 | 2,323 | 2,424 | 2,661 | 2,680 | 2,754 | 2,822 | 2,900 | 3,145 | 3,365 | 3,579 | 3,825 | -- | -- | -- |
| India: pwt63:Real GDP per capita (Constant Prices: Laspeyres), derived from growth rates of domestic absorption (international dollar) | 2,553 | 101.84% | 1,940 | 1,887 | 1,932 | 1,932 | 2,017 | 2,173 | 2,213 | 2,250 | 2,317 | 2,546 | 2,556 | 2,636 | 2,734 | 2,847 | 3,125 | 3,365 | 3,598 | 3,880 | -- | -- | -- |
| India: pwt63:Real Gross Domestic Product per Capita, current price (international dollar) | 2,410 | 162.25% | 1,509 | 1,542 | 1,604 | 1,671 | 1,763 | 1,907 | 1,970 | 2,075 | 2,194 | 2,396 | 2,457 | 2,580 | 2,651 | 2,833 | 3,053 | 3,365 | 3,712 | 4,100 | -- | -- | -- |
| India: pwt70:PPP Converted Domestic Absorption Per Capita, average GEKS-CPDW, at current prices (international dollar) | 2,004 | 271.85% | 1,072 | 1,075 | 1,140 | 1,174 | 1,261 | 1,389 | 1,422 | 1,501 | 1,581 | 1,739 | 1,761 | 1,850 | 1,919 | 2,084 | 2,299 | 2,722 | 3,047 | 3,450 | 3,711 | 3,885 | -- |
| India: pwt70:PPP Converted GDP Per Capita, G-K method, at current prices (international dollar) | 1,898 | 254.91% | 1,031 | 1,046 | 1,099 | 1,142 | 1,222 | 1,334 | 1,368 | 1,441 | 1,515 | 1,660 | 1,696 | 1,782 | 1,846 | 1,994 | 2,180 | 2,556 | 2,859 | 3,206 | 3,402 | 3,588 | -- |
| India: pwt71:PPP Converted Domestic Absorption Per Capita, average GEKS-CPDW, at current prices (international dollar) | 2,120 | 301.57% | 1,088 | 1,091 | 1,157 | 1,190 | 1,276 | 1,406 | 1,434 | 1,515 | 1,596 | 1,755 | 1,787 | 1,884 | 1,961 | 2,123 | 2,368 | 2,671 | 2,974 | 3,379 | 3,620 | 3,969 | 4,277 |
| India: pwt71:PPP Converted GDP Per Capita, G-K method, at current prices (international dollar) | 2,000 | 280.43% | 1,048 | 1,061 | 1,115 | 1,157 | 1,236 | 1,349 | 1,380 | 1,455 | 1,528 | 1,674 | 1,717 | 1,810 | 1,882 | 2,034 | 2,229 | 2,492 | 2,771 | 3,121 | 3,307 | 3,637 | 3,996 |
| India: wdi201709:GDP per capita (constant 2015 US dollar) | 798 | 138.71% | 533 | 528 | 545 | 560 | 586 | 618 | 653 | 666 | 695 | 743 | 758 | 781 | 797 | 845 | 898 | 954 | 1,015 | 1,076 | 1,093 | 1,162 | 1,244 |
| India: wdi201709:GDP per capita (current US dollar) | 582 | 303.31% | 368 | 303 | 317 | 301 | 346 | 374 | 400 | 415 | 413 | 442 | 443 | 452 | 471 | 547 | 628 | 715 | 807 | 1,028 | 999 | 1,102 | 1,358 |
| Dataset and exact metric name | Average | Growth (start to end, using linear fit on logarithm) | 19900000 | 19910000 | 19920000 | 19930000 | 19940000 | 19950000 | 19960000 | 19970000 | 19980000 | 19990000 | 20000000 | 20010000 | 20020000 | 20030000 | 20040000 | 20050000 | 20060000 | 20070000 | 20080000 | 20090000 | 20100000 |
|---|---|---|---|---|---|---|---|---|---|---|---|---|---|---|---|---|---|---|---|---|---|---|---|
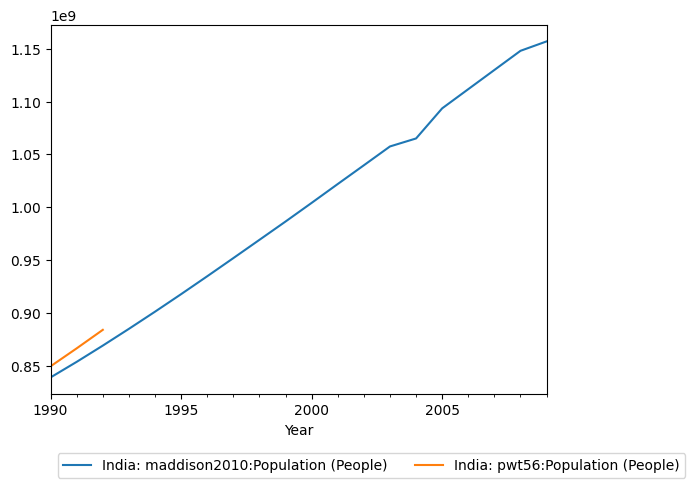
| India: maddison2010:Population (People) | 996,814,106 | 38.88% | 839,000,000 | 853,724,032 | 869,089,984 | 884,942,976 | 901,176,000 | 917,772,032 | 934,691,968 | 951,860,992 | 969,153,024 | 986,476,992 | 1,004,124,032 | 1,021,966,976 | 1,039,691,008 | 1,057,504,000 | 1,065,070,976 | 1,093,563,008 | 1,111,714,048 | 1,129,865,984 | 1,147,996,032 | 1,156,898,048 | -- |
| India: pwt56:Population (People) | 866,671,339 | 4.06% | 849,515,008 | 866,499,008 | 884,000,000 | -- | -- | -- | -- | -- | -- | -- | -- | -- | -- | -- | -- | -- | -- | -- | -- | -- | -- |
| India: pwt80:Population (People) | 1,051,895,320 | 39.96% | 873,785,472 | 891,910,208 | 910,064,576 | 928,226,048 | 946,373,312 | 964,486,144 | 982,553,280 | 1,000,558,144 | 1,018,471,168 | 1,036,258,688 | 1,053,898,112 | 1,071,374,272 | 1,088,694,016 | 1,105,885,696 | 1,122,991,232 | 1,140,042,880 | 1,157,038,592 | 1,173,971,584 | 1,190,863,616 | 1,207,740,416 | 1,224,614,272 |
| India: pwt81:Population (People) | 1,051,895,320 | 39.96% | 873,785,472 | 891,910,208 | 910,064,576 | 928,226,048 | 946,373,312 | 964,486,144 | 982,553,280 | 1,000,558,144 | 1,018,471,168 | 1,036,258,688 | 1,053,898,112 | 1,071,374,272 | 1,088,694,016 | 1,105,885,696 | 1,122,991,232 | 1,140,042,880 | 1,157,038,592 | 1,173,971,584 | 1,190,863,616 | 1,207,740,416 | 1,224,614,272 |
| India: pwt90:Population (People) | 1,052,414,452 | 41.58% | 870,601,792 | 888,513,856 | 906,461,376 | 924,475,648 | 942,604,224 | 960,875,008 | 979,290,432 | 997,817,280 | 1,016,402,880 | 1,034,976,640 | 1,053,481,088 | 1,071,888,192 | 1,090,189,312 | 1,108,369,536 | 1,126,419,328 | 1,144,326,272 | 1,162,088,320 | 1,179,685,632 | 1,197,070,080 | 1,214,182,144 | 1,230,984,448 |