Documentation on region.php: You need to include three parameters: region (which can typically take a value of a country, though some larger regions are also allowed), start_date (which is of the form YYYY0000), and end_date (which is of the form YYYY0000). Both start_date and end_date are inclusive. For instance, to get data for India from 1970 to 2010, use /region.php?region=India&start_date=19700000&end_date=20100000.
| Dataset and exact metric name | Average | Growth (start to end, using linear fit on logarithm) | 19700000 | 19710000 | 19720000 | 19730000 | 19740000 | 19750000 | 19760000 | 19770000 | 19780000 | 19790000 | 19800000 |
|---|---|---|---|---|---|---|---|---|---|---|---|---|---|
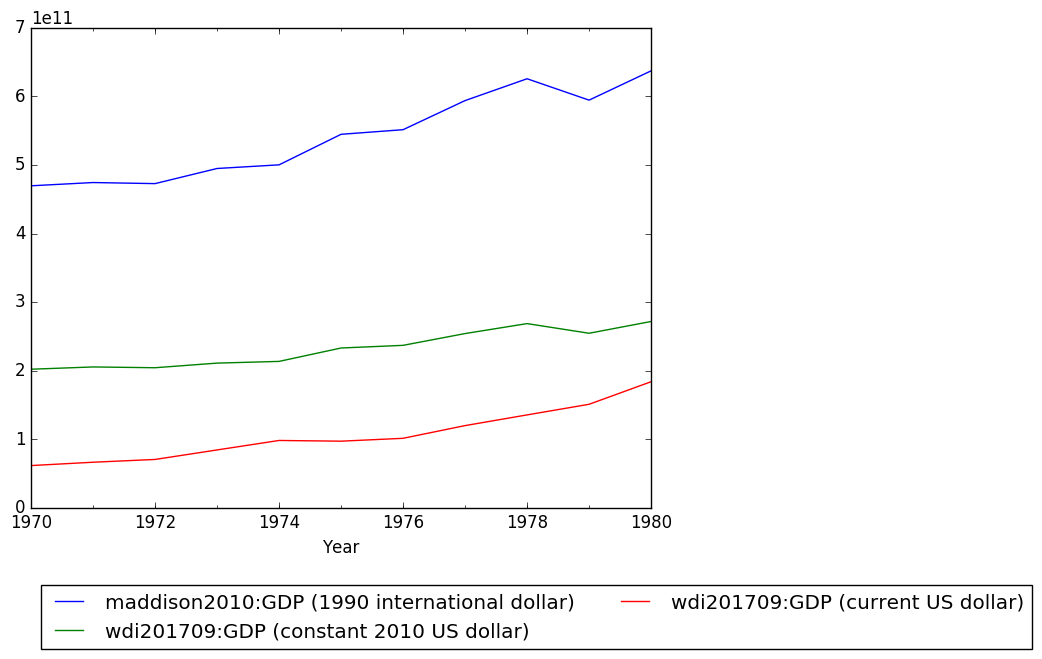
| India: maddison2010:GDP (1990 international dollar) | 541,726,548,713 | 40.40% | 469,583,986,688 | 474,338,000,896 | 472,765,988,864 | 494,831,992,832 | 500,146,012,160 | 544,682,999,808 | 551,402,012,672 | 593,834,016,768 | 625,694,998,528 | 594,510,020,608 | 637,202,006,016 |
| India: wdi201709:GDP (constant 2015 US dollar) | 231,648,000,559 | 39.16% | 201,528,934,400 | 204,839,911,424 | 203,706,531,840 | 210,419,728,384 | 212,913,897,472 | 232,395,341,824 | 236,260,311,040 | 253,400,449,024 | 267,876,024,320 | 253,844,193,280 | 270,942,683,136 |
| India: wdi201709:GDP (current US dollar) | 107,779,309,568 | 182.96% | 62,422,482,944 | 67,350,986,752 | 71,463,190,528 | 85,515,272,192 | 99,525,902,336 | 98,472,796,160 | 102,717,161,472 | 121,487,319,040 | 137,300,295,680 | 152,991,645,696 | 186,325,352,448 |
| Dataset and exact metric name | Average | Growth (start to end, using linear fit on logarithm) | 19700000 | 19710000 | 19720000 | 19730000 | 19740000 | 19750000 | 19760000 | 19770000 | 19780000 | 19790000 | 19800000 |
|---|---|---|---|---|---|---|---|---|---|---|---|---|---|
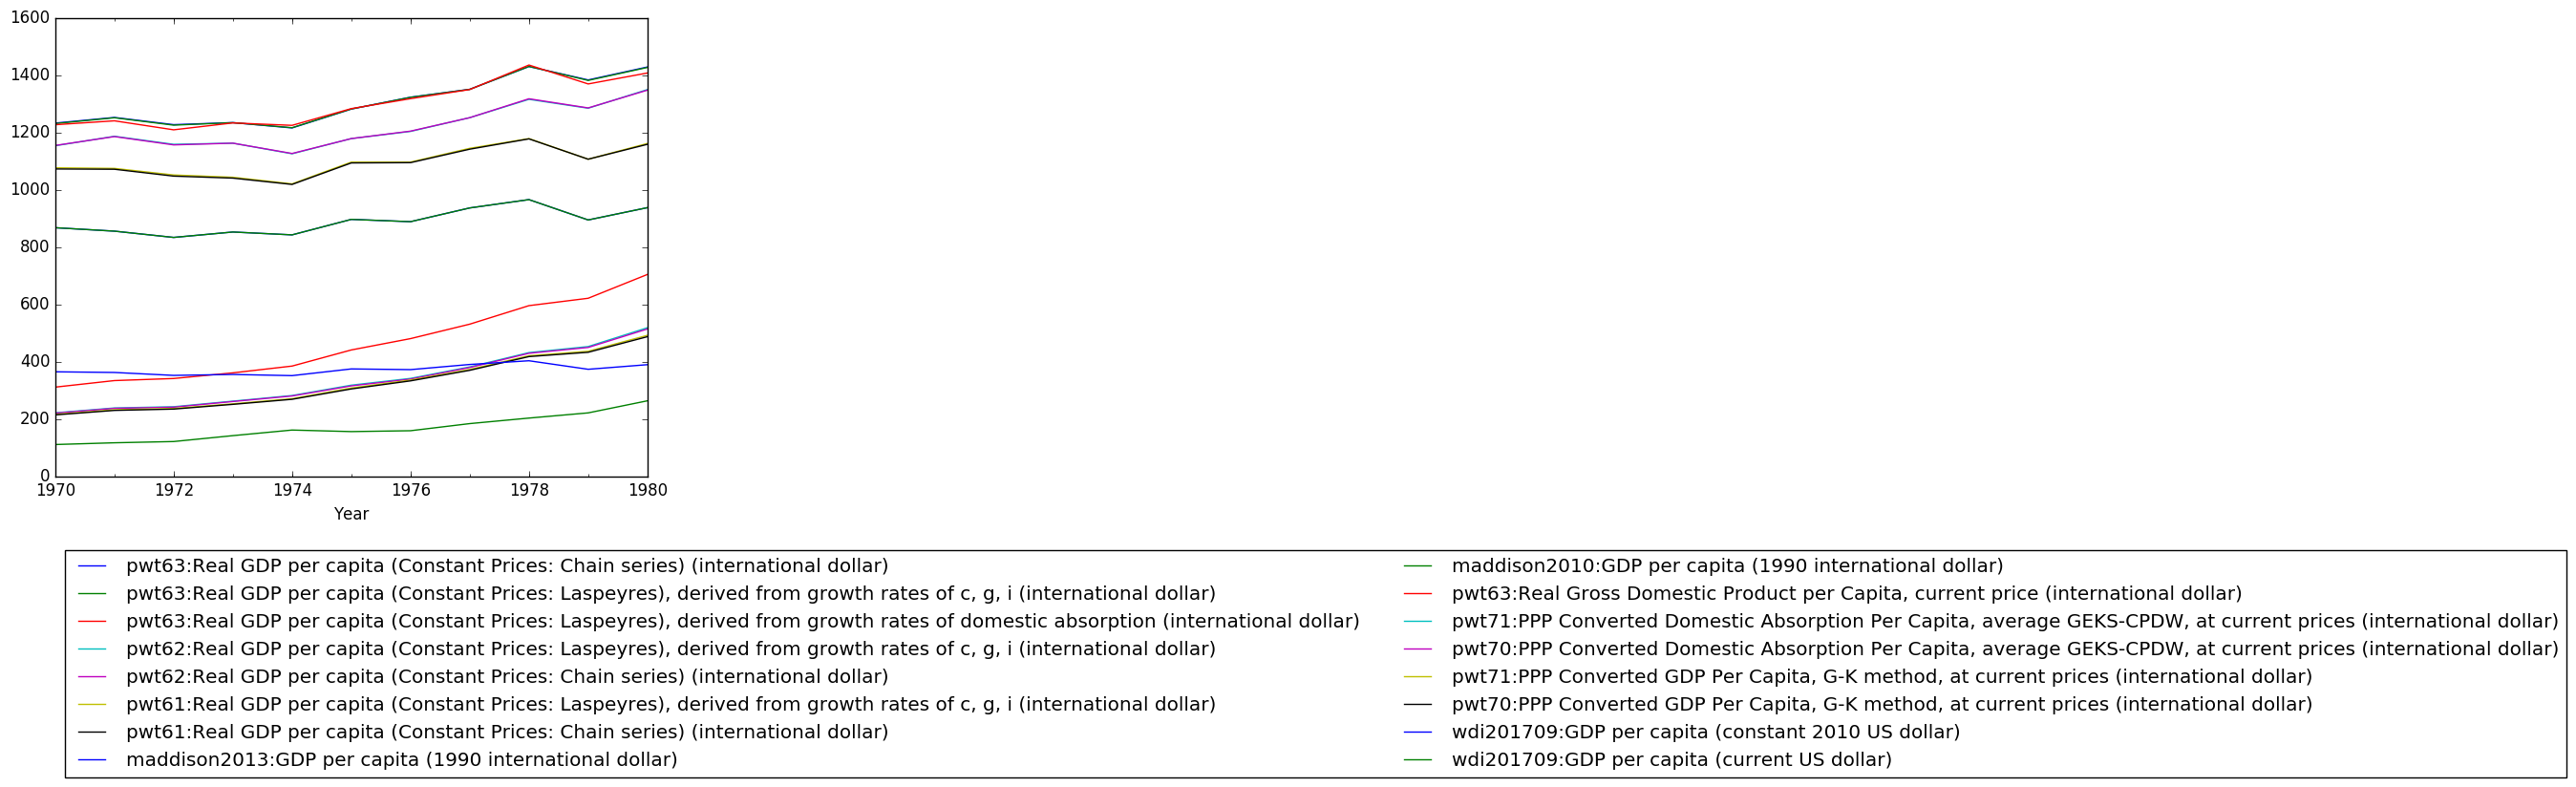
| India: maddison2010:GDP per capita (1990 international dollar) | 889 | 12.01% | 868 | 856 | 834 | 853 | 843 | 897 | 889 | 937 | 966 | 895 | 938 |
| India: maddison2013:GDP per capita (1990 international dollar) | 889 | 12.01% | 868 | 856 | 834 | 853 | 843 | 897 | 889 | 937 | 966 | 895 | 938 |
| India: pwt61:Real GDP per capita (Constant Prices: Chain series) (international dollar) | 1,093 | 10.74% | 1,073 | 1,072 | 1,048 | 1,041 | 1,019 | 1,094 | 1,095 | 1,142 | 1,178 | 1,107 | 1,159 |
| India: pwt61:Real GDP per capita (Constant Prices: Laspeyres), derived from growth rates of c, g, i (international dollar) | 1,096 | 10.47% | 1,077 | 1,075 | 1,052 | 1,044 | 1,021 | 1,097 | 1,097 | 1,145 | 1,179 | 1,107 | 1,162 |
| India: pwt62:Real GDP per capita (Constant Prices: Chain series) (international dollar) | 1,216 | 16.73% | 1,155 | 1,186 | 1,157 | 1,163 | 1,127 | 1,179 | 1,205 | 1,252 | 1,318 | 1,286 | 1,348 |
| India: pwt62:Real GDP per capita (Constant Prices: Laspeyres), derived from growth rates of c, g, i (international dollar) | 1,216 | 16.68% | 1,154 | 1,187 | 1,159 | 1,163 | 1,126 | 1,179 | 1,204 | 1,252 | 1,316 | 1,285 | 1,350 |
| India: pwt63:Real GDP per capita (Constant Prices: Chain series) (international dollar) | 1,306 | 18.39% | 1,233 | 1,253 | 1,228 | 1,235 | 1,216 | 1,282 | 1,323 | 1,351 | 1,430 | 1,384 | 1,429 |
| India: pwt63:Real GDP per capita (Constant Prices: Laspeyres), derived from growth rates of c, g, i (international dollar) | 1,305 | 18.43% | 1,232 | 1,252 | 1,226 | 1,235 | 1,217 | 1,282 | 1,323 | 1,351 | 1,431 | 1,382 | 1,427 |
| India: pwt63:Real GDP per capita (Constant Prices: Laspeyres), derived from growth rates of domestic absorption (international dollar) | 1,300 | 18.30% | 1,227 | 1,241 | 1,210 | 1,234 | 1,225 | 1,284 | 1,318 | 1,350 | 1,436 | 1,370 | 1,408 |
| India: pwt63:Real Gross Domestic Product per Capita, current price (international dollar) | 465 | 131.28% | 312 | 334 | 342 | 361 | 385 | 441 | 481 | 531 | 596 | 622 | 705 |
| India: pwt70:PPP Converted Domestic Absorption Per Capita, average GEKS-CPDW, at current prices (international dollar) | 334 | 136.19% | 221 | 238 | 242 | 261 | 281 | 316 | 340 | 380 | 430 | 450 | 515 |
| India: pwt70:PPP Converted GDP Per Capita, G-K method, at current prices (international dollar) | 323 | 133.91% | 215 | 230 | 235 | 251 | 269 | 305 | 333 | 370 | 418 | 433 | 488 |
| India: pwt71:PPP Converted Domestic Absorption Per Capita, average GEKS-CPDW, at current prices (international dollar) | 336 | 136.67% | 222 | 239 | 243 | 263 | 282 | 318 | 342 | 382 | 432 | 453 | 519 |
| India: pwt71:PPP Converted GDP Per Capita, G-K method, at current prices (international dollar) | 325 | 133.80% | 216 | 233 | 237 | 253 | 271 | 308 | 336 | 373 | 421 | 437 | 492 |
| India: wdi201709:GDP per capita (constant 2015 US dollar) | 370 | 10.50% | 363 | 361 | 351 | 354 | 350 | 373 | 371 | 388 | 401 | 372 | 388 |
| India: wdi201709:GDP per capita (current US dollar) | 169 | 124.68% | 112 | 119 | 123 | 144 | 163 | 158 | 161 | 186 | 206 | 224 | 267 |
| Dataset and exact metric name | Average | Growth (start to end, using linear fit on logarithm) | 19700000 | 19710000 | 19720000 | 19730000 | 19740000 | 19750000 | 19760000 | 19770000 | 19780000 | 19790000 | 19800000 |
|---|---|---|---|---|---|---|---|---|---|---|---|---|---|
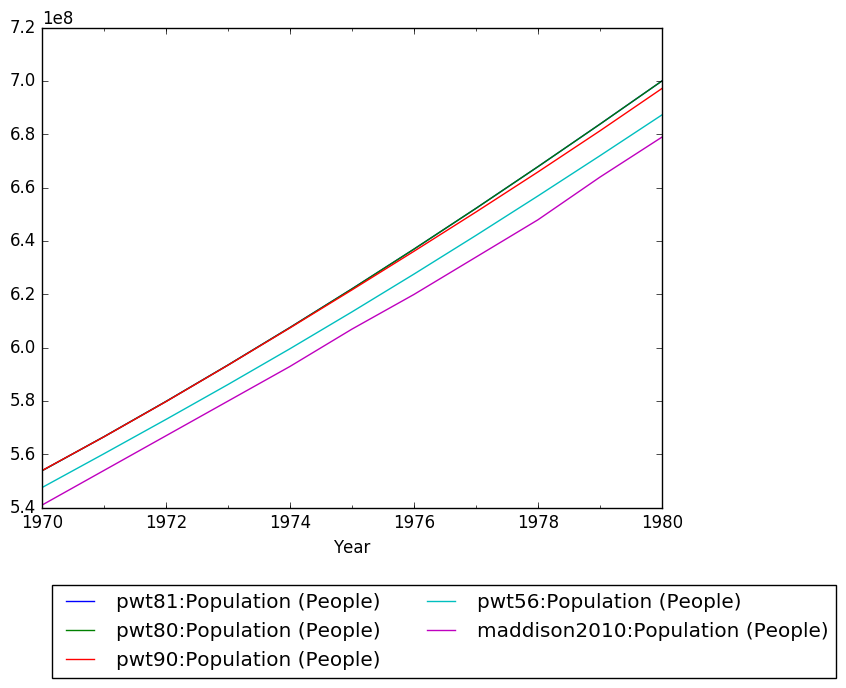
| India: maddison2010:Population (People) | 607,909,091 | 25.33% | 541,000,000 | 554,000,000 | 567,000,000 | 580,000,000 | 593,000,000 | 607,000,000 | 620,000,000 | 634,000,000 | 648,000,000 | 664,000,000 | 679,000,000 |
| India: pwt56:Population (People) | 615,122,641 | 25.53% | 547,569,024 | 560,268,032 | 573,129,984 | 586,220,032 | 599,643,008 | 613,459,008 | 627,632,000 | 642,134,016 | 656,940,992 | 672,020,992 | 687,331,968 |
| India: pwt80:Population (People) | 624,066,508 | 26.47% | 553,873,920 | 566,651,456 | 579,871,104 | 593,526,656 | 607,606,592 | 622,096,704 | 636,992,576 | 652,279,296 | 667,917,440 | 683,857,280 | 700,058,560 |
| India: pwt81:Population (People) | 624,066,508 | 26.47% | 553,873,920 | 566,651,456 | 579,871,104 | 593,526,656 | 607,606,592 | 622,096,704 | 636,992,576 | 652,279,296 | 667,917,440 | 683,857,280 | 700,058,560 |
| India: pwt90:Population (People) | 623,142,400 | 25.91% | 553,943,232 | 566,605,376 | 579,800,640 | 593,451,904 | 607,446,528 | 621,703,616 | 636,182,784 | 650,907,584 | 665,936,448 | 681,358,528 | 697,229,760 |